In April, ReFED released the inaugural update to the Insights Engine's Food Waste Monitor, Solutions Database, Impact Calculator, and Policy Finder, providing an assessment of surplus and wasted food in 2020 and 2021 that represents the most up-to-date, publicly accessible estimates of food loss and waste across the U.S. food system. As part of this update, we have also improved surplus and greenhouse gas emissions estimates from previous years – the result of methodological improvements that we have applied retroactively to present a more accurate picture of surplus food and its impact over time. Additionally, we have refined the assumptions underlying 21 of the 42 modeled solutions featured in our Solutions Database, yielding improved diversion potential and financial cost and benefit projections.
These updates are also accompanied by significant improvements to the Insights Engine’s backend technology that enables us to generate estimates for a wide array of indicators across the food supply chain. We have transformed the way we process data and run models, which has radically improved our ability to produce estimates, conduct and interpret calculations, and explore new scenarios. We are excited about this progress and what it will mean for our future work – including our next update, which we expect to release late this fall.
For now, here are the new estimates, observations on pandemic impacts, and our assessment of how we as a community can capture progress towards the 2030 goal of halving food waste by 50%.
Surplus and Waste Food in 2021
In 2021, the United States generated 91 million tons of surplus food. Surplus food is defined as food that goes unsold or uneaten, including edible and inedible parts that are donated, fed to animals, repurposed to produce other products, composted, anaerobically digested, or disposed of. This is approximately 38% of the U.S. food supply's 241 million tons of food, equating to roughly 549 pounds of annual surplus food per person. The value of this surplus food amounts to $444 billion, or 2% of U.S. GDP.
Of all surplus food, only 22% was inedible parts; an additional 33% was spoiled or discarded due to safety concerns. That means around 45% of surplus was still considered fit for human consumption at the time of disposal, yet food businesses only donated 1.8 million tons, or approximately 2% of surplus food. Another 10% was recycled as animal feed or utilized for industrial purposes, and 20% was composted or anaerobically digested.
"In 2021, the United States generated 91 million tons of surplus food.... equating to roughly 549 pounds of annual surplus food per person."
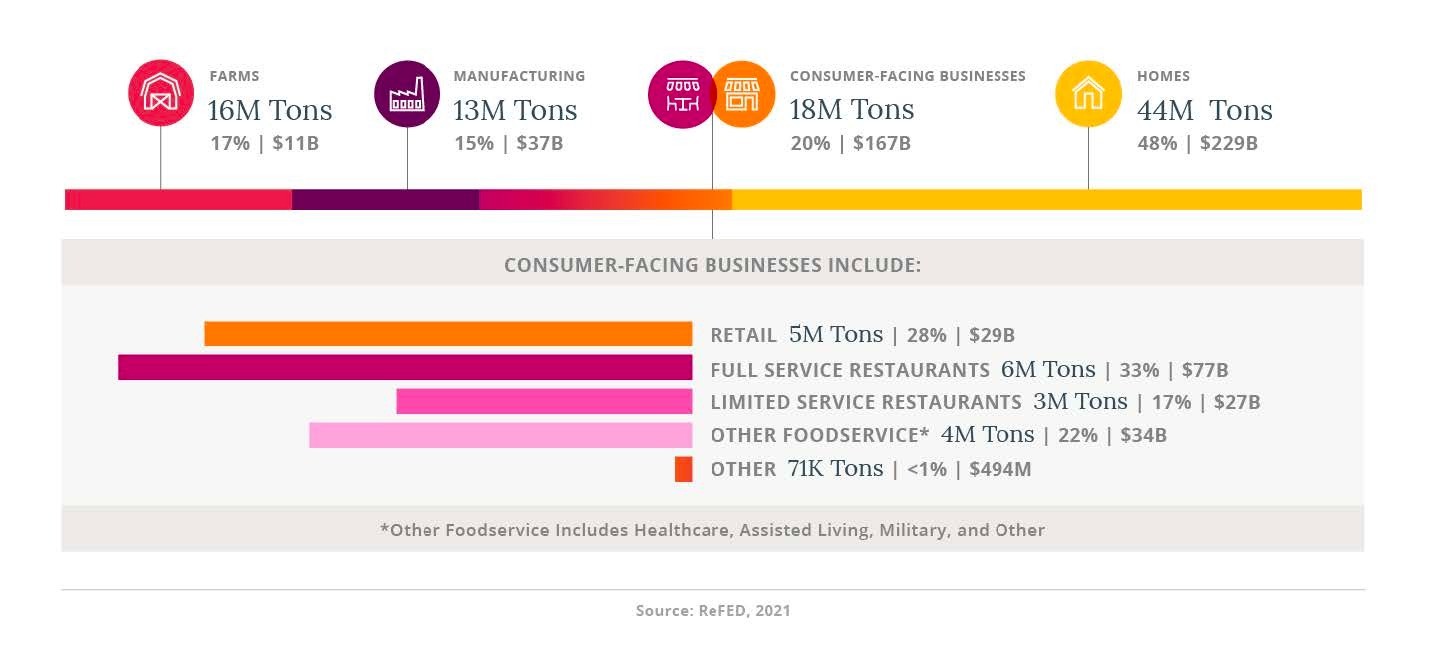
While loss and waste is a problem that affects the entire food system, households produced nearly half of all surplus food in 2021. In fact, the average American throws out $690 worth of food at home annually. Some of this waste is inevitable – think eggshells and chicken bones – which accounted for 34% of residential surplus. But nearly 50% was wasted due to improper food management practices and over-portioning.

All other sectors (farm, manufacturing, retail, and foodservice) produced 47 million tons of surplus food, worth approximately $215 billion, or 10% of the total $2 trillion that Americans spent on food in 2021. The farm sector generated the second-highest volume of surplus, followed by manufacturing and foodservice, and then retail.
The Environmental Impacts of Surplus and Wasted Food in 2021
Greenhouse gas (GHG) emissions associated with surplus and wasted food are equally concerning. In 2021, surplus food accounted for 380 million metric tons of carbon dioxide equivalent (MMT CO2e). This translates to 6% of total U.S. GHG emissions, according to the EPA’s Inventory – the annual equivalent of driving 84 million passenger vehicles or powering 73 million homes’ electricity. Producing surplus food requires 22 trillion gallons of fresh water, representing 22% of the country’s freshwater use. To put this into perspective, this excess water usage is equal to the combined freshwater use of California, New York, and Texas. The land required to produce surplus food accounts for 16% of cropland use, according to the EPA.
"In 2021, surplus food accounted for 380 million metric tons of carbon dioxide equivalent (MMT CO2e). This translates to 6% of total U.S. GHG emissions."
Emissions from Upstream vs. Disposal Activities
ReFED’s data shows that 93% of surplus food emissions occur "upstream," before food exits the human value chain, while only 7% come from downstream activities, which include all management pathways taken once food becomes surplus. This means that redirecting food waste from landfills to alternative destinations such as animal feed or compost may not significantly reduce emissions, since most of the emissions have already been generated. Therefore, preventing surplus from happening in the first place is critical. This is particularly concerning, as food is the primary source of methane emissions in landfills, which are the third largest source of methane emissions. However, emissions from landfills are only a small part of the overall food waste footprint. While we should move towards a more circular approach to the food system, it is essential to recognize the importance of preventing surplus food.
"Upstream activities account for 93% of surplus food emissions, with just 7% coming from downstream activities."
Residential Emissions
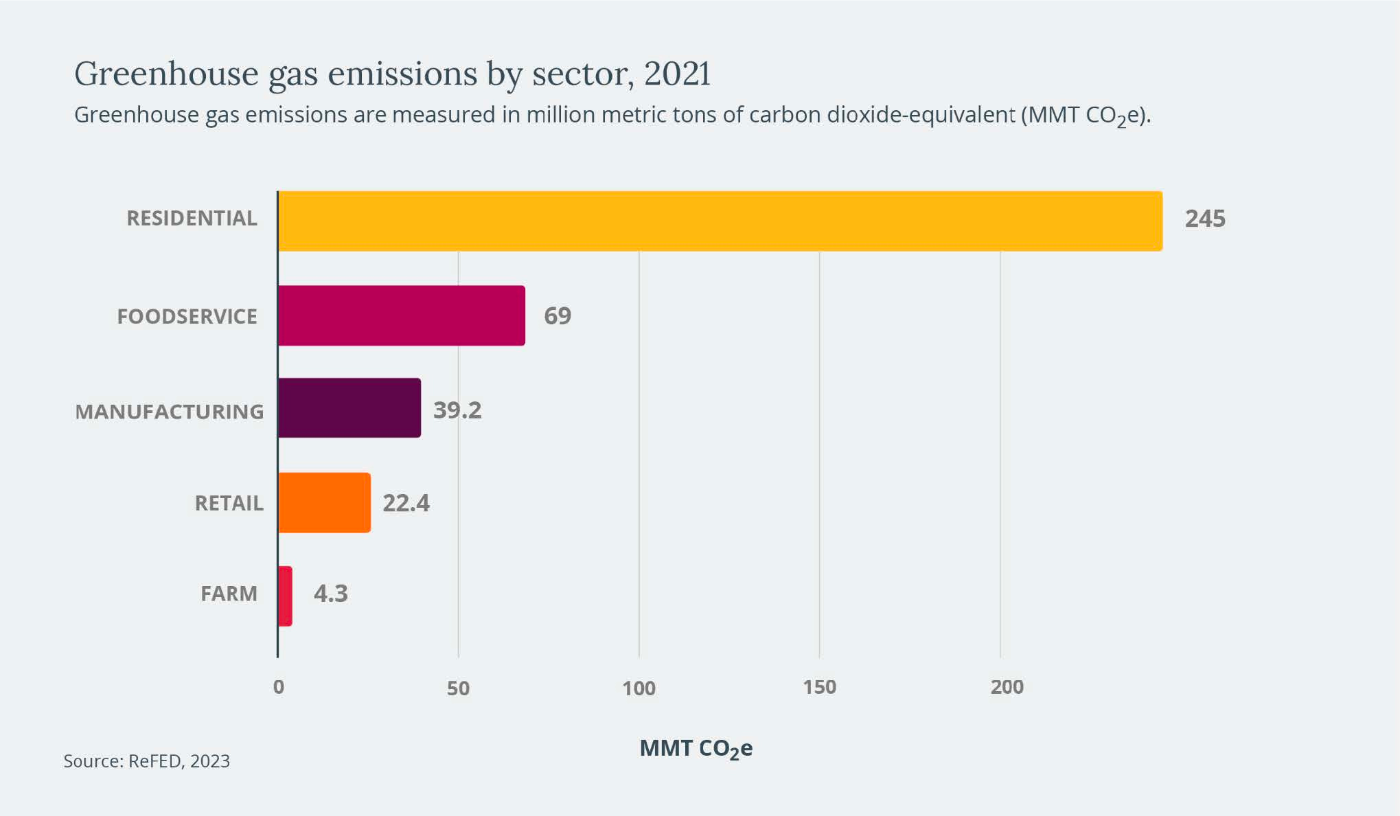
In 2021, the emissions embodied by surplus generated from households reached 245 MMT CO2e, or almost 65% of emissions from all surplus food. The outsized contribution from the residential sector is a function of three factors: first, the residential sector generates the most food waste by volume; second, the food discarded by the residential sector embodies all of the emissions that it accrues moving through the supply chain; and third, that food discarded by the residential sector is often disposed of in the least preferred (i.e., the most emissions-intensive) destinations like landfill, incineration, and sewer.
Fresh meat and seafood, dairy and eggs, and prepared foods – which often contain high levels of meat and dairy – contribute the most to surplus food emissions. This is not necessarily surprising, as livestock products tend to have a higher footprint.
Food Waste Reduction Solutions
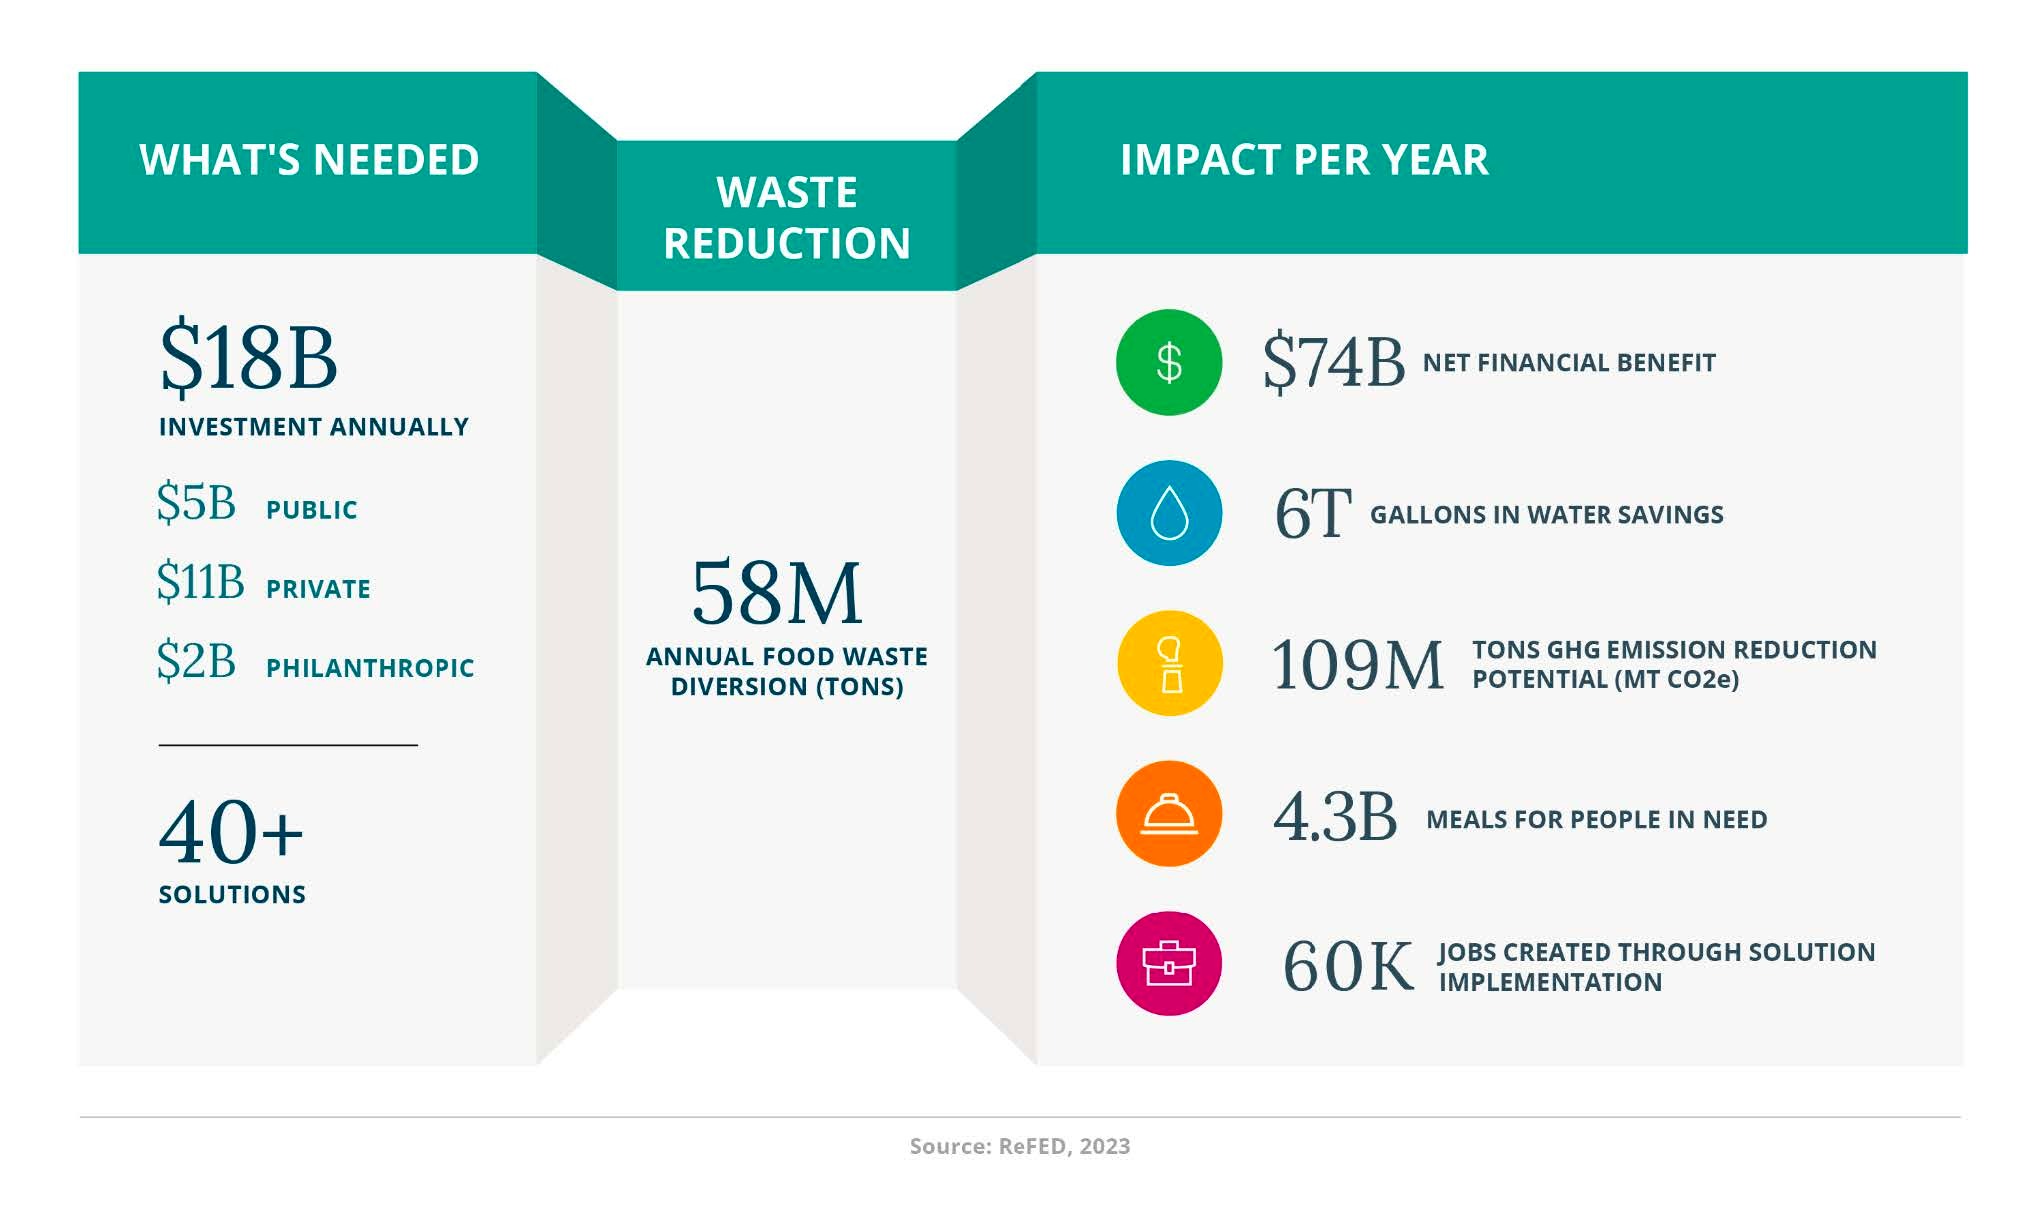
For this Insights Engine update, ReFED validated and improved the underlying parameters and assumptions of the models for fifteen prevention solutions and all six recycling solutions featured in the Solutions Database. Our most recent estimates suggest that completely adopting the 42 modeled solutions across relevant sectors would prevent 108 MMT CO2e of unnecessary greenhouse gas emissions, save 6.2 trillion gallons of water, and recover the equivalent of 4.3 billion meals each year. In addition to these impacts, implementing these solutions would yield substantial financial gains, with an investment of $18 billion leading to a net financial benefit of $74 billion – an impressive 4:1 return on investment.
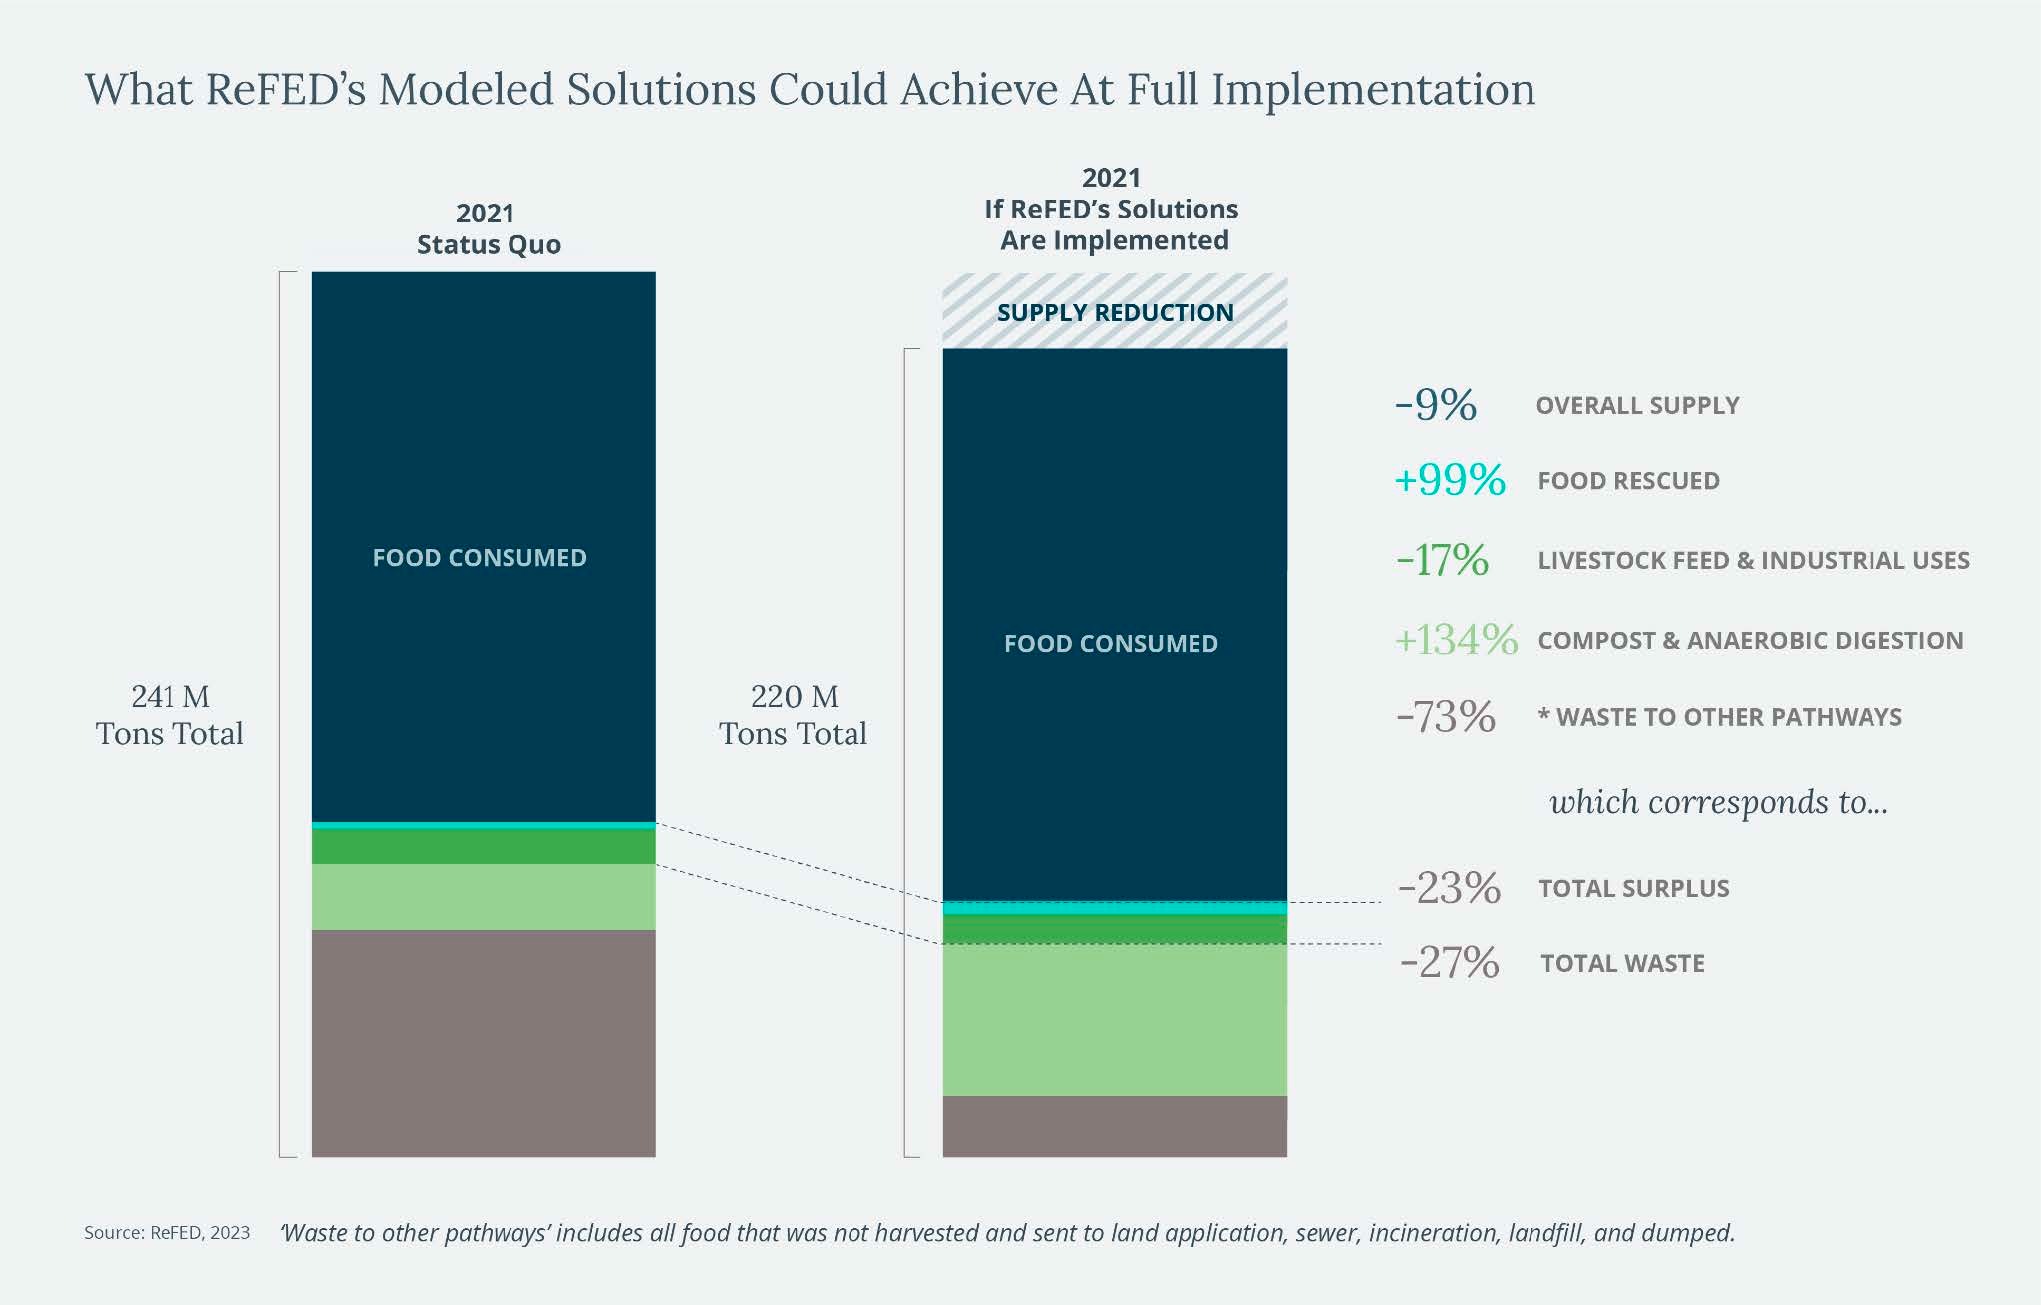
 If fully implemented, all solutions could potentially reduce the required supply for the U.S. food system by 9%. This is critical to meeting future food needs with fewer resources. The suite of solutions we analyzed would achieve a net reduction of food sent to waste destinations by 27% and a reduction of surplus by 23%. The chart below shows the projected change in amount of material sent to each destination, as well as the breakdown of what constitutes waste verses surplus reduction.
"The suite of solutions would achieve a net reduction of food sent to waste destinations by 27% and a reduction of surplus by 23%."
Implementing prevention and rescue solutions (donation) alone would notably reduce 90.2 million MT CO2e, representing 83% of the overall GHG benefit despite only accounting for 41% of the total tons diverted to preferred destinations. This reinforces the effectiveness of addressing surplus upstream – a ton prevented or donated has benefits many times that of a ton recycled.
"Implementing prevention and rescue solutions would represent 83% of the overall GHG benefit despite only accounting for 41% of the total tons diverted to preferred destinations."
The top 10 solutions in terms of highest net economic benefit, absolute tons diverted, and highest emissions reductions include the following:
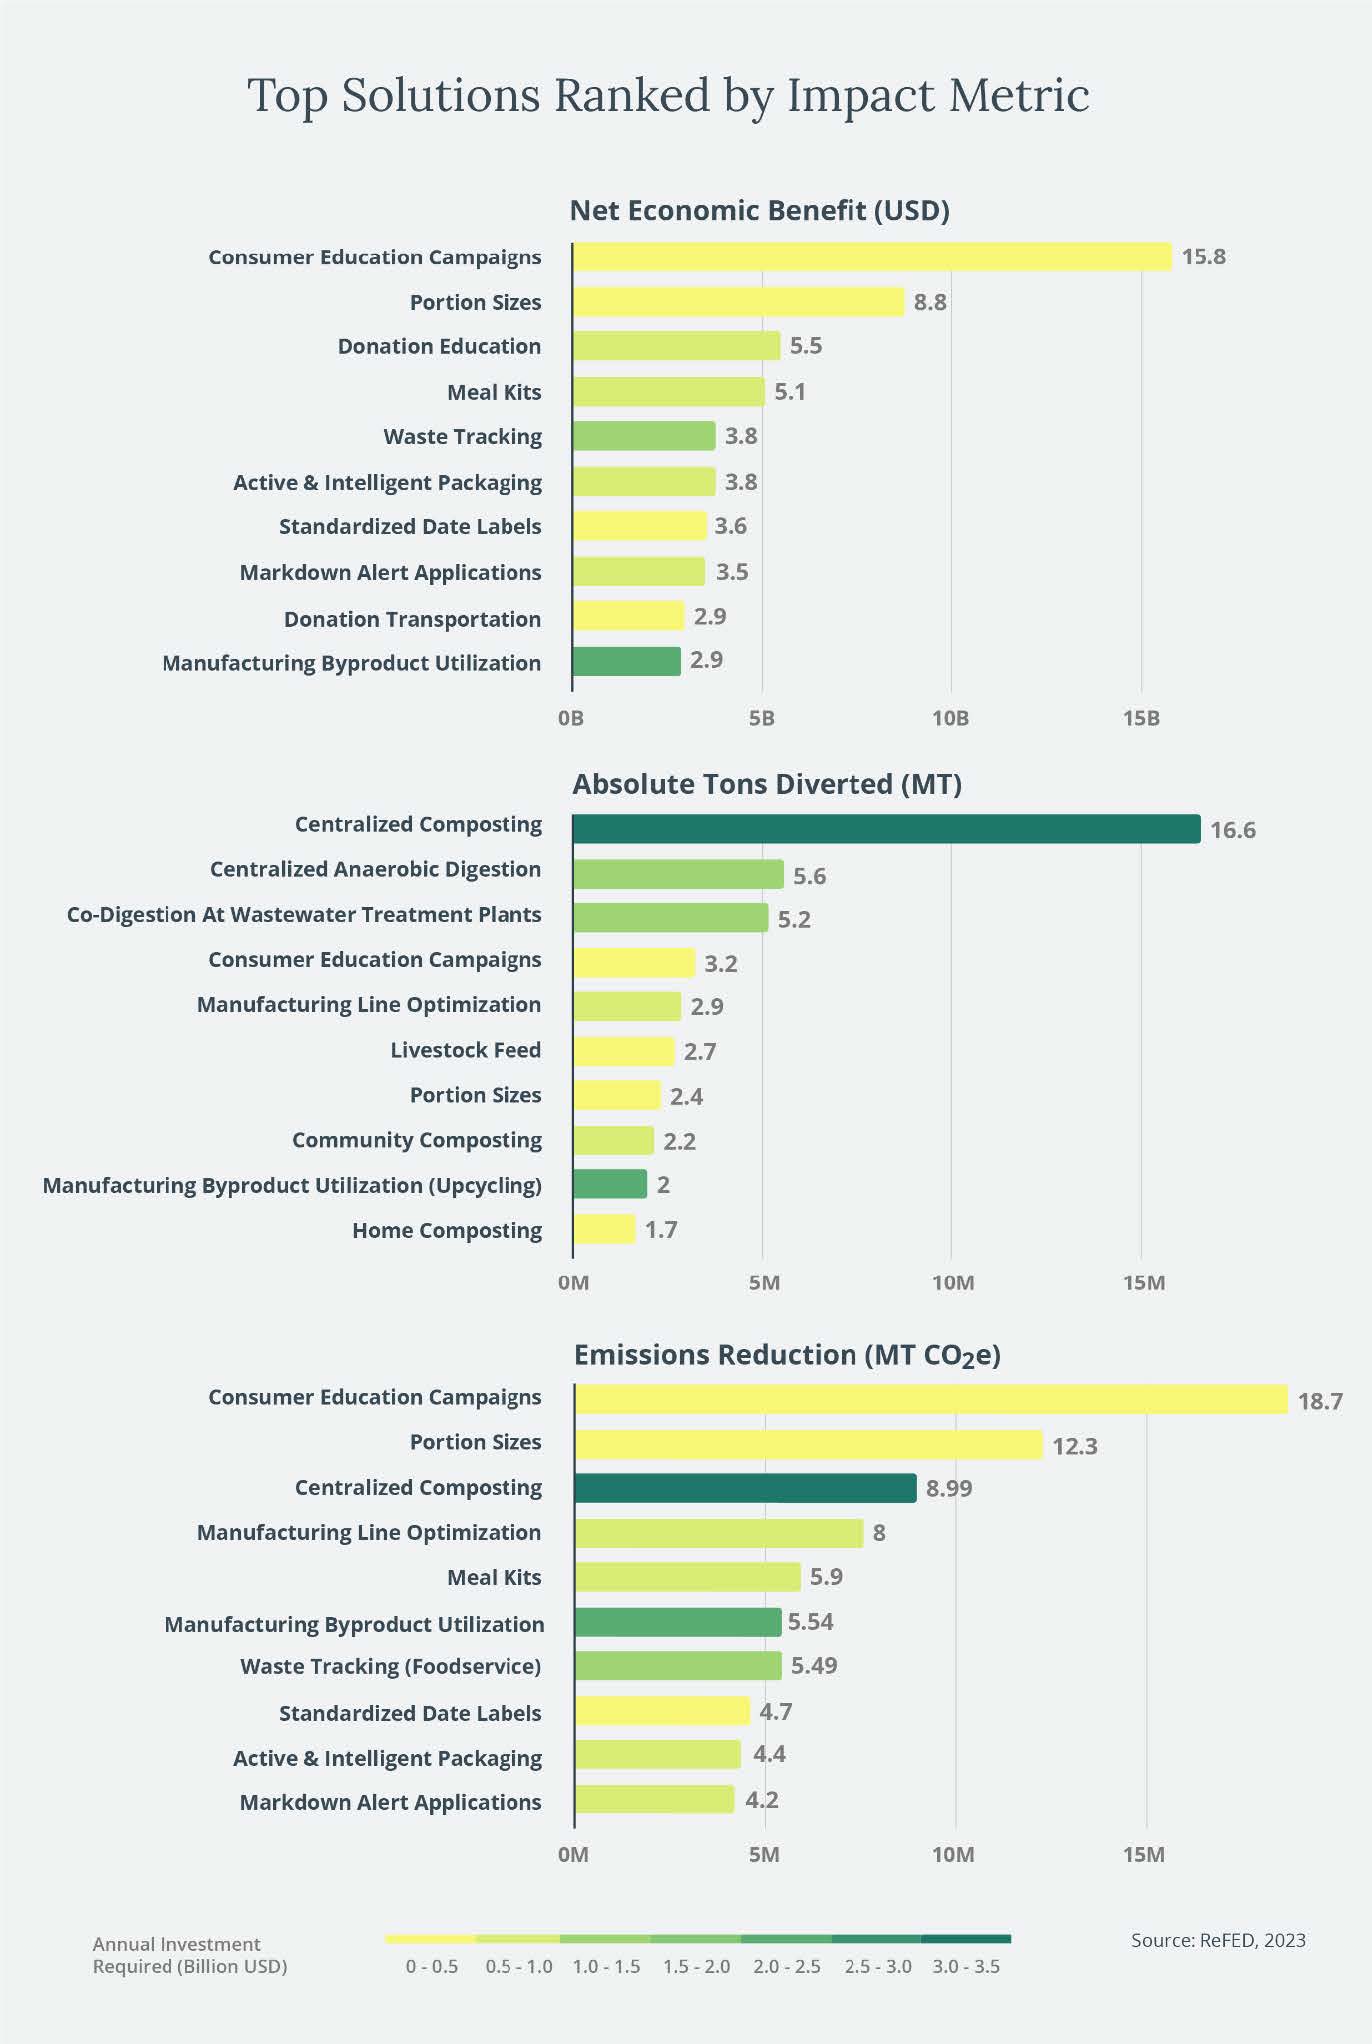
While ReFED's modeled food waste reduction solutions may not achieve a 50% reduction, there is still hope. Our analysis does not account for several other approaches and solutions that require further research and analysis, such as 31 unmodeled solutions in the Insights Engine Solutions Database, including early spoilage detection, innovative grower contracts, and inventory traceability, among others. There are also a number of "tried-and-true" best practices – such as developing multi-faceted employee engagement campaigns to reduce food waste, performing regular maintenance on refrigerated trucks, and cultivating close partnerships with waste vendors – that we do not have enough data to model but know are effective. Taken together, these solutions and proven best practices offer potential to scale reductions across the supply chain.
Change Over Time: Progress Toward the 2030 Commitment & COVID-19
In 2015, the U.S. Environmental Protection Agency (EPA) and the U.S. Department of Agriculture (USDA) announced a joint domestic goal seeking to halve food loss and waste by the year 2030. In 2021, in an effort to align with international goals, EPA broadened its definition of waste to include compost and anaerobic digestion as waste destinations to be minimized, thereby significantly increasing the ambition of the goal.
Despite these variations, however, ReFED’s analysis suggests that surplus food has increased, rather than being reduced. Our modeling found that between 2016 and 2021, annual surplus food in the U.S. increased by 4.8%. Total surplus reached its peak in 2019, and then experienced a slight decline in 2020, most likely due to the impacts of COVID-19 across the value chain. It then increased to roughly the same levels as 2019. Controlling for population growth, per capita surplus food increased by 2% from the 2016 baseline.
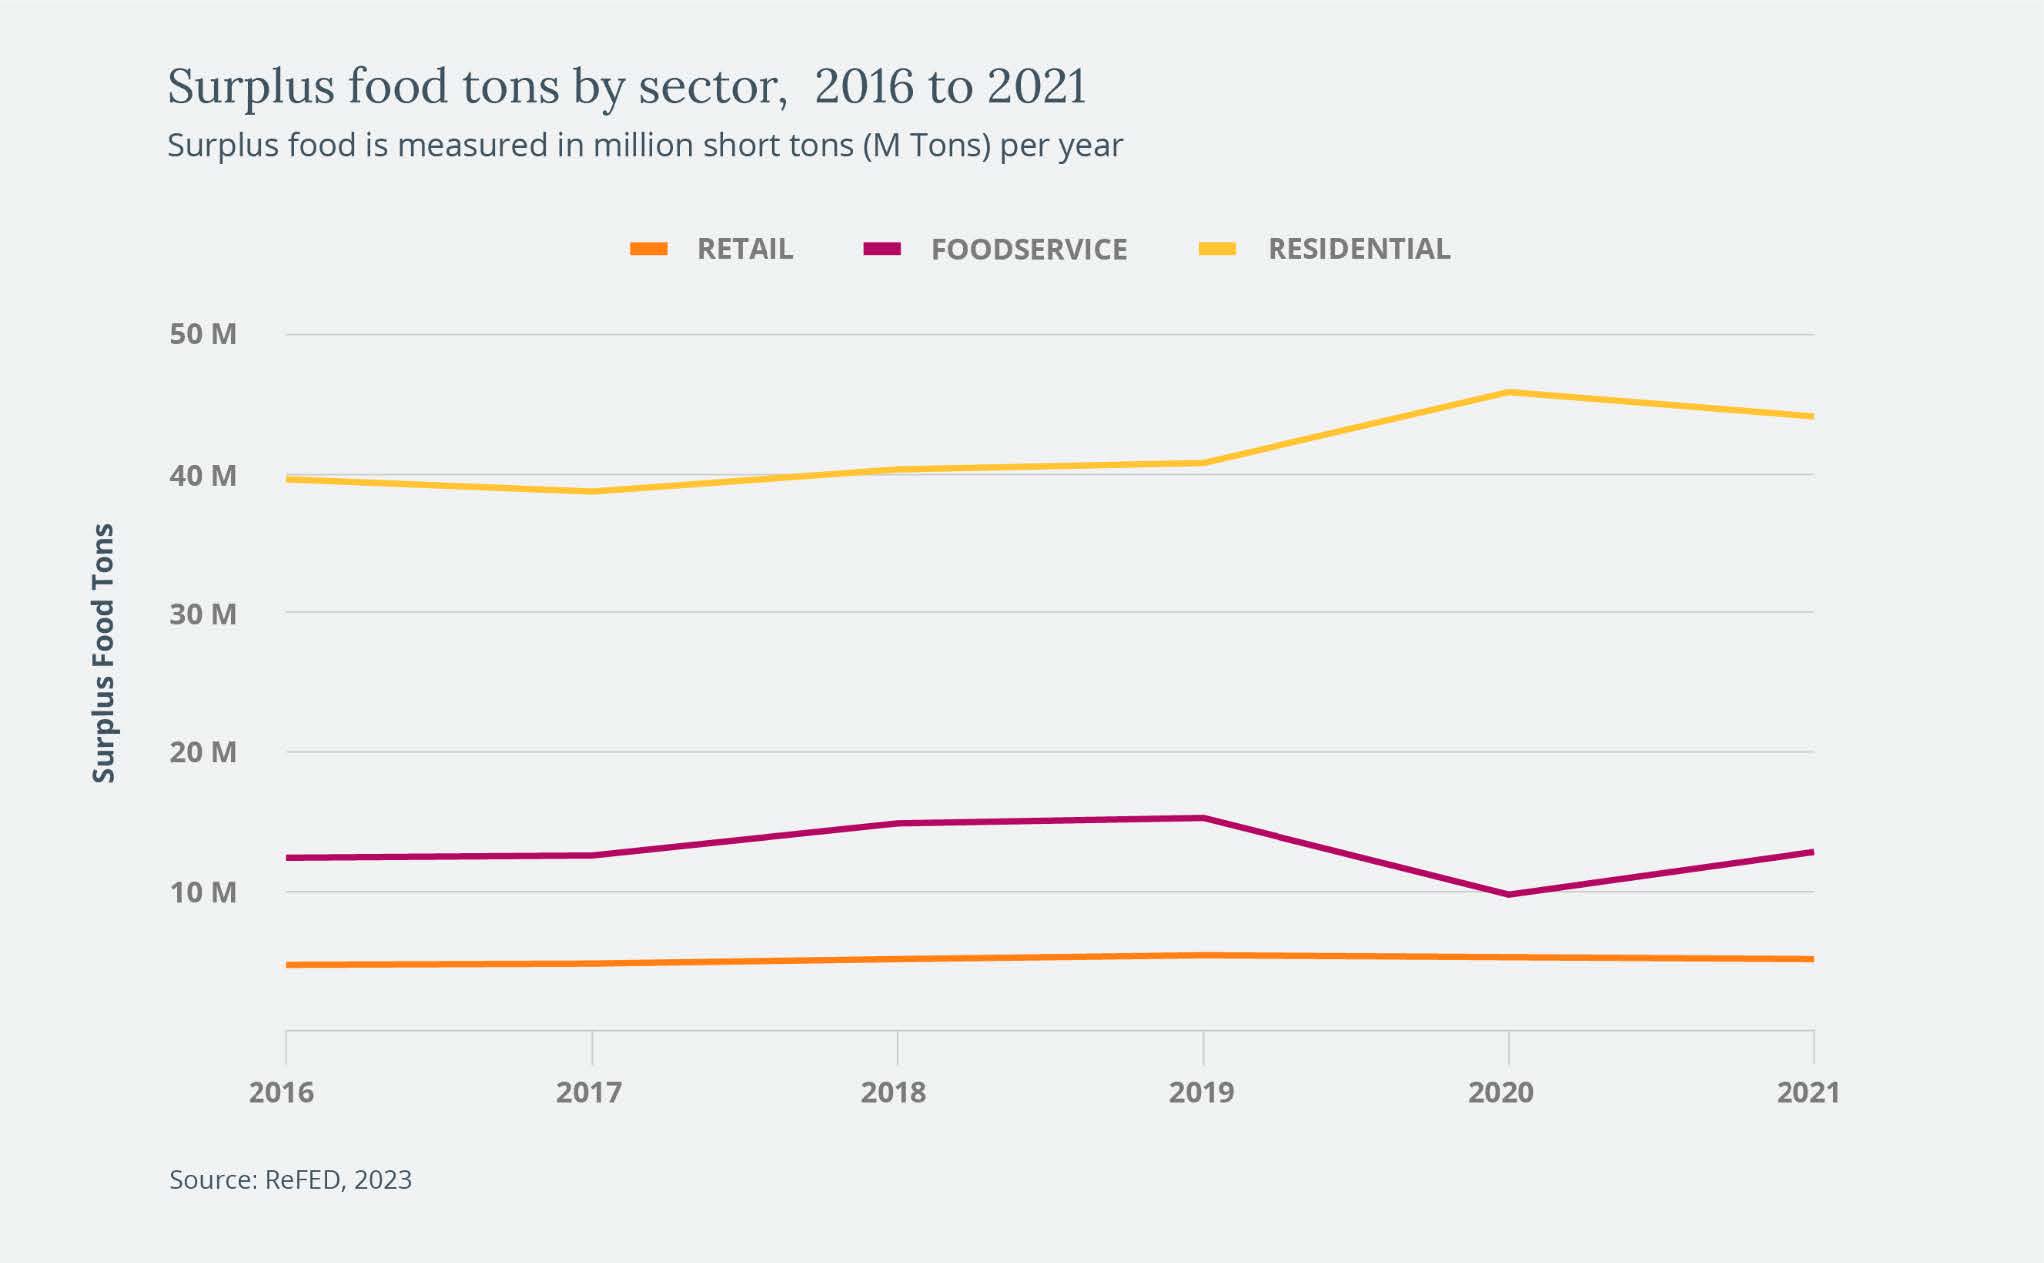
The Covid-19 pandemic had a profound impact on the food system, causing labor and supply chain disruptions that were accompanied by significant fluctuations in surplus food levels. The closure of major segments of the foodservice industry, coupled with a surge in demand for groceries and at-home cooking, had far-reaching consequences to food production and distribution. Based on ReFED’s analysis, surplus food was swiftly reallocated from foodservice establishments to retail and households.
At the height of the pandemic in 2020, total surplus decreased by 1.3%. Foodservice surplus fell precipitously by 36%, as mandated lockdowns and heightened safety apprehensions led to restaurant closures. Meanwhile, retail surplus decreased by 2.6%, as grocery stores struggled to keep shelves stocked. Residential surplus food increased during this time by 12%, which may be attributed to increased home purchasing. Research suggests that some of the behaviors in household food–such as panic buying and food hoarding–may have led to more household waste (Laato et al., 2020; Roe et al., 2020). By 2021, however, surplus food largely returned to pre-pandemic levels.
"Between 2016 and 2021, annual surplus food in the U.S. increased by 4.8%."
Looking Ahead
The 2020 and 2021 data published in this update highlights the urgent need to double down on the persistent issue of wasted food across the U.S. supply chain. While progress toward the goal of halving food waste by 2030 has been sluggish, a surge in awareness of this issue has led to promising advances in reducing food waste by businesses, governments, and consumers alike. However, continued improvements in data are necessary to track changes in surplus and guide the development and implementation of reduction strategies throughout the entire chain.
This update marks a significant methodological improvement, as we have incorporated retail surplus rates that vary over time, thanks to data reporting from the Pacific Coast Food Waste Commitment (PCFWC) initiative. As we move toward our next update, set to be released in the fall, we aim to build on this progress and incorporate even more data from private, public, and academic partnerships. This will provide a more accurate and nuanced portrayal of food loss and waste across the system, facilitating the efforts of all stakeholders working toward reducing food waste in the country.
We are eager to continue this work and welcome contributions and partnerships in support of our shared mission. We thank all our partners for their continued support and look forward to making progress toward a more sustainable, resilient, and inclusive food system.