The Roadmap outlines systems for accomplishing a food waste reduction goal of 20 percent in the near term and 50 percent in the next 15 years. The strategy requires further investment — of time, brainpower and dollars.
H. Briggs, J.D. Lindeberg, A. Rein, B. Chorn and K. Tanger
BioCycle June 2016, Vol. 57, No. 5, p. 32
This article references tables available in BioCycle Magazine in print.
Every year, the U.S. spends $218 billion growing, processing, transporting and disposing of roughly 63 million tons of food that ultimately goes uneaten (ReFED, 2016). That waste embodies nutrients, water and farmland, as well as energy demands of fertilizer production and the tractors, trawlers and trucks used along the way.
After careers in business as well as environmental and sustainable agriculture philanthropy, Betsy and Jesse Fink were well aware of the food waste problem in America. They witnessed first hand on their own farm the ways food can be lost from farm to fork, and decided to take action. Leveraging their mission-driven Fink Family Foundation, they catalyzed an initiative to answer the critical questions:
What solutions have the most potential for impact?
How much government, private and philanthropic funding is needed?
What’s the potential for a market-based approach?
How can new sources of capital, innovation, consumer education and public policy be leveraged?
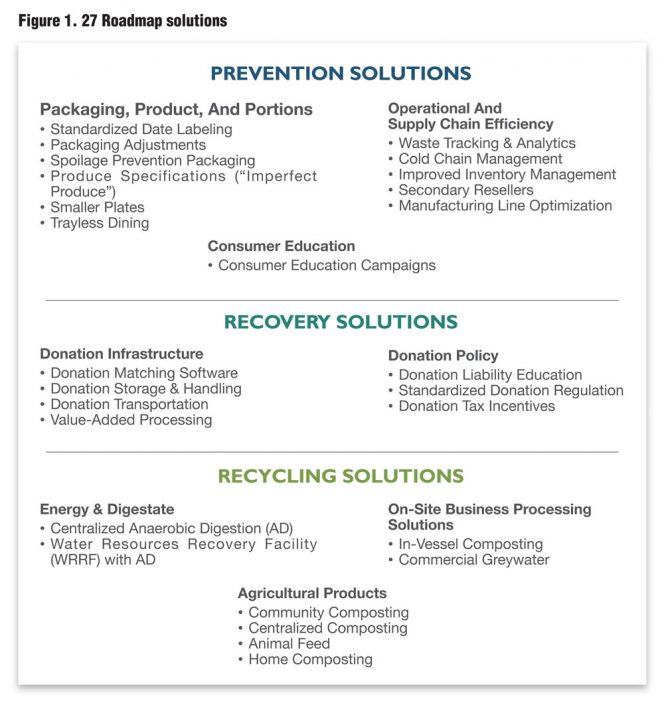
Figure 1. 27 Roadmap solutions
After a year of building partnerships with over a dozen other foundations and assembling a team, the nonprofit initiative ReThink Food Waste through Economics and Data (ReFED) was launched in 2015. The team received assistance and input from more than 30 partners including leading businesses, nongovernmental organizations (NGOs) and government from the federal to municipal level who are committed to reducing food waste. The project objective was to build a roadmap that outlined the economic potential and investment required to reduce food waste in the United States at scale, as well as the priority actions required from each key stakeholder. On March 9, ReFED released “A Roadmap to Reduce Food Waste by 20 Percent” (Roadmap). All data reported in this article comes from the ReFED Roadmap (ReFED, 2016) unless otherwise noted.
The first step for ReFED was to quantify the problem. Relying on waste characterizations, regional studies and extensive secondary research, the project team applied best known data about industrial and commercial food waste generation by business type to enable calculations at the county level. Residential waste was calculated on a per capita basis and accounts for roughly 43 percent of the food waste total. The second largest category of waste comes from consumer-facing businesses (restaurants, retail grocers, institutional, foodservice). Remaining industrial waste numbers are low because the industry is already recycling an estimated 95 percent of its waste stream, primarily for animal feed. The analysis estimated over 10 million tons of on-farm losses tilled into the soil each year, a significantly higher number than previous estimates. Table 1 summarizes the data collected.
Wasted food occurs for many reasons including convenience, misaligned incentives or goals, and complex consumer behaviors. Most are a result of solvable problems related to logistics or transportation; scarce or siloed information (within food businesses, between businesses, e.g., farmers, distributors and grocers, and between entities, e.g., municipalities and NGOs); inefficient operating practices; or public policies that fail to incentivize waste reduction behaviors. Any solution must address one or more of these problems as means to preventing, recovering for human consumption, or recycling wasted food for alternative applications.
Starting with a set of more than 50 potential solutions, ReFED applied four screening criteria to yield the highest priority solutions detailed in the Roadmap:
- Supporting Data: Is there sufficient data from one or more credible sources to support the assessment?
- Cost-Effectiveness: Can the solution offer a positive, or near break-even Economic Value to society?
- Scaling Potential: Is the solution limited to specific applications or niches, or does it have significant potential to scale?
- Feasibility: Can specific stakeholders implement the solution today without major changes to technology or policy?
After applying these criteria, the Roadmap ultimately focused on 27 solutions (Figure 1) across eight categories. It adopted the U.S. EPA’s Food Recovery Hierarchy framework to categorize the solutions into prevention, recovery and recycling (Figure 2). These solutions primarily target consumer-facing food businesses, where market share is concentrated among a small set of companies that impact waste upstream through farms and manufacturers, and downstream through consumers.
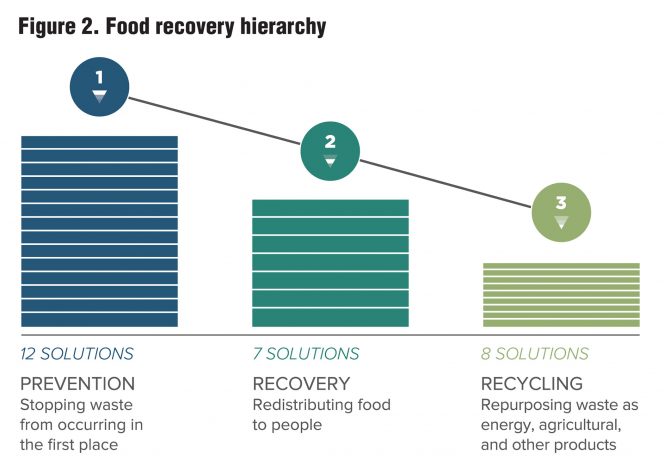
Figure 2. Food recovery hierarchy
Many viable solutions exist beyond those in the Roadmap. ReFED considered more than two dozen additional solutions that were excluded due to issues of data, scalability, cost-effectiveness, or near term feasibility. The Roadmap recommends that additional research be conducted on these solutions. Screened solutions targeted to farms include improved pest management, planning tools, modified seed traits, and policies targeting farm bill subsidies and immigration. Additional solutions screened from the Roadmap include:
- Consumer Food Recovery: Neighborhood efforts to recover food from homes to be shared with other families in need.
- SKU Rationalization: The practice of retailers narrowing item assortments to reduce imbalances between supply and demand.
- Food Saving Containers: Storage containers that can lengthen shelf life at retail and in the home.
- Online Grocery Shopping: Online shopping does not require fresh produce to sit in retail environments and can shorten the supply chain from producer to consumer.
- Case Size Optimization: Although facing potential issues of damage and cost-effectiveness, adjusting case size at the distributor level based on retailer purchasing habits can help retailers prevent over purchasing.
Marginal Food Waste Abatement Cost Curve
The Marginal Food Waste Abatement Cost Curve (Figure 3) ranks the 27 solutions based on marginal cost-effectiveness, with the assumption that the key constraint to reduction is financial capital and that society should invest to solve food waste in the most efficient ways possible. The cost curve portrays the 27 solutions based on: 1) Diversion Potential to eliminate waste in tons; and 2) Ability for each ton eliminated to generate Economic Value. The Economic Value shown in the cost curve is driven by the investment required and ongoing costs and financial benefits across all stakeholders, including businesses, investors, consumers and the government.
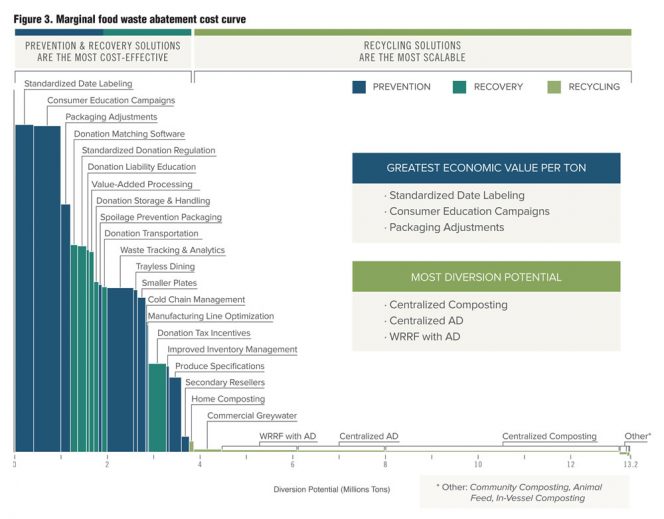
Figure 3. Marginal food waste abatement cost curve
To help understand the cost curve, several factors should be noted:
- It answers the question, “If the government or society wants to reduce food waste, what strategies will create the most value to society and what are most scalable?”
- It does not answer the question, “If I am an investor, which opportunity will give me the highest return on investment?” This is because each project has funding and benefits that come from and accrue to different stakeholders, so it all depends on who the stakeholders are and what they value.
- A unified cost of capital of 4 percent is used for all solutions.
- The cost curve only includes hard costs/savings and replacement value of donated food. It does not include water and carbon savings, job creation, or other secondary local economic benefits. (ReFED recommends that cities seek to weigh these factors in specific cost-benefit analyses.)
The net Economic Value and cost-effectiveness of prevention and recovery, which capture the value of edible food, are many times higher than those gained from recycling food scraps. This is because food, once wasted by consumers, is worth 25 to 50 times less than its original retail value. Additionally, though there are exceptions (i.e. Secondary Resellers and Donation Tax Incentives), prevention and recovery solutions typically require relatively low upfront investment. But in total, they represent only slightly higher than a quarter of the diversion potential.
Conversely, recycling solutions offer nearly three-quarters of the total tons of diversion potential, driven mainly by Centralized Composting and Anaerobic Digestion, but the overall Economic Value created is significantly lower. This is due in part to the heavy investment for large processing and trucking infrastructure that most centralized recycling solutions require, coupled with the lower value of food scraps (vs. edible food).
Prevention will yield the highest overall economic impact pound for pound, relying primarily on changing behaviors, but it is largely nascent across the food value chain. The prevention solutions outlined here can avoid 2.6 million tons of waste while generating an annual $8 billion of system Economic Value, mainly in the form of cost savings to consumers and businesses. Consumers currently lose the retail value of every wasted pound, or nearly $5,000/ton. With almost half of all wasted food coming from households and a substantial fraction generated by consumers in restaurants and food service, influencing consumers will have the biggest pay off. While a lack of customer social license has previously inhibited efforts to introduce imperfect produce and reduce package and plate sizes, Consumer Education Campaigns that target these and other issues can annually reduce nearly 584,000 tons and save consumers $2.7 billion. Simply eliminating confusion through Standardization of Date Labels can divert nearly 400,000 tons annually with a $1.8 billion benefit annually to consumers.
Every wasted ton of food that occurs up the supply chain imposes $1,000 to $2,000 of wholesale costs to businesses (calculation excludes farmers and retail purchases). Improved Waste Tracking & Analytics, which has the potential to divert 570,000 tons of wasted food annually generating an estimated $1.3 billion in gross business cost savings, is the most economically favorable solution targeted to food businesses. This data gives food service, institutions, restaurants and prepared food sellers the ability to correct wasteful practices and make operational changes. Other top solutions include Packaging Adjustments, annually yielding $715 million in total Economic Value and saving 200,000 tons, and Produce Specifications to accept an estimated 266,000 tons of “ugly produce” and unlocking $277 million of value.
When food can no longer be sold, but is still safe for human consumption, it can be recovered from food businesses and transported to food recovery organizations to help the nearly 50 million Americans who experience food insecurity (Feeding America, 2015.). Fluctuating sources of excess supply, liability and cost considerations have emerged as barriers to increased recovery. Food recovery organizations such as Feeding America and others have long served this need. The Roadmap identified potential for 1.1 million additional tons to be recovered for hunger relief, roughly double current volumes. It is estimated that this potential increase could be captured from an additional investment of $870 million annually, while recovering food with replacement value of $2.4 billion annually. Replacement value does not include all of the embedded resources, but rather what it would actually cost to purchase or acquire that food for hunger relief if it were not donated. The added infrastructure and capacity could generate a conservative estimate of 4,000 jobs and create additional indirect and induced economic impacts.
The top solution for bolstering recovery is additional Tax Incentives that provide credits or deductions to offset the added costs for food businesses to separate, store and transport food for recovery. This solution builds upon the enhanced tax deductions passed in late 2015 as part of the Protecting Americans from Tax Hikes (PATH) Act. Additional annual tax deductions could divert more than 380,000 tons creating $470 million in additional Economic Value (based on the replacement value of the food donated).
The second major opportunity for recovery comes from standardized safe handling regulations. Today, inconsistent health department regulations serve as a deterrent to donations. The Food and Drug Administration provides a nonbinding framework, leading to a patchwork of state and local health department codes dictating if and when food that is past its “date” can be donated. Common policy from the federal government could enable businesses nationwide to eliminate confusion around liability and increase donations by nearly 200,000 tons annually, creating $553 million in value. In addition to policy, technology in the form of Donation Matching Software can play a role by connecting donors with recipients, enabling smaller-scale food donations. Donation matching software programs have the potential to divert 150,000 tons at $432 million in value.
Nearly three-quarters of the near term, cost-effective opportunity to reduce food waste comes from recycling food scraps. With focused investment in major metropolitan populations centers, 9.5 million annual tons could be recycled creating Economic Value worth $121 million. Roughly 90 percent of this opportunity is expected to come from centralized composting and anaerobic digestion (AD) facilities, with 10 percent coming from distributed recycling solutions in homes, communities and businesses.
Centralized composting shows potential to process 5 million additional tons with an estimated $18 million Economic Value. As with many recycling solutions, facility economics fluctuate regionally. Key drivers that will dictate the business case for a composter in a given region include: disposal costs; climate; site availability; compost markets; costs of labor, bulking agents, property; and access to financing. Centralized composting facilities will range from smaller than 3,000 tons/year (TPY) to extremely large facilities exceeding 100,000 TPY. The total cost on a per ton basis highly depends on economies of scale.
Centralized AD potential is also substantial, estimated at nearly 2 million annual tons and Economic Value of $40 million. Project activity has grown in recent years as existing manure or wastewater treatment digesters have increasingly incorporated organic fractions of municipal solid waste. Size and technology varies widely from low solids, continuously stirred tank reactors to dry fermentation systems with higher contamination resiliency. The economics follow many of the same regional drivers impacting composting systems, heavily relying on tipping fee revenues and energy prices. Overall, the Northeast and Northwest regions showed the strongest economics for centralized composting and AD.
Densely populated metropolitan statistical areas (MSAs) are looking to facilities traditionally focused on “wastewater treatment” to expand their aims to capture the water, nutrients and embedded energy found in treatment of municipal sewage. These facilities are becoming known in the industry as Water Resource Recovery Facilities (WRRFs). Since half of food waste comes from households, in-sink grinders paired with today’s pipe infrastructure was considered as part of the strategy for delivering material to recovery facilities equipped with efficient treatment processes and AD energy capture, along with truck-based transportation of additional food scraps directly to WRRF AD facilities. ReFED estimates the diversion potential of WRRF with AD in large MSAs at 1.6 million tons annually with Economic Value generation at $38 million.
Financial And Nonfinancial Benefits
Nearly every presented solution generates Economic Value to society as a whole, with a few falling just short of break-even. Given interest from food businesses and investors, an additional analysis was conducted to look solely at the potential for additional business profit from each solution using commercial costs of capital. This analysis also explored whether incentives were split with a mismatch between those who will incur costs and those who will reap benefits, which would create a barrier to action unless additional philanthropic or government capital could be provided.
The Roadmap estimates an opportunity for nearly $2 billion of annual Business Profit Potential, a direct result of revenues and cost savings from nine prevention and two recycling solutions. Restaurants and food service operators are best positioned to capitalize on this opportunity and are expected to receive 85 percent of the profit potential. Waste Tracking & Analytics, Smaller Plate utilization and relaxed Produce Specifications together present a business opportunity of roughly $1.5 billion each year.
As noted, the Economic Value shown in the cost curve includes only direct cost savings, revenues, and the replacement value of food recovered. A more comprehensive measurement would incorporate the many “nonfinancial” benefits of these solutions into economic terms. For example, what is the expected value of greenhouse gas (GHG) abatement? The solutions in the Roadmap would yield an expected annual GHG abatement of 18 million tons MTCO2e (metric tons of carbon dioxide equivalent). The social benefit of this alone, at the EPA estimate of $11 to $56/ton per carbon credit could be worth $1 billion. (The EPA calculates the societal value of GHG reductions, including improved health, reduced disaster costs, etc.) This estimate may be far too low, however. A 2015 paper in Nature Climate Change (Moore and Diaz, 2015) asserts this value should actually be $220/ton, which would place the social benefit of food waste reduction at $4 billion.
The creation of 15,000 jobs, mostly related to recovery and recycling, could create additional secondary benefits by supporting a circular economy. This can lead to numerous additional indirect impacts upstream through the supplier network as well as induced impacts downstream when employees purchase goods and services at a household level.
Finally, one of the surprise findings of the Roadmap is the large associated water conservation that can be achieved through preventing or recovering food waste. At 1.6 trillion gallons per year for 3.7 millions tons/year of food waste prevention and recovery, the expected water savings is 1 to 2 percent of all freshwater consumed in the United States. Furthermore, most of this conservation would occur in California and other drought-prone states that are large producers of perishable foods. Additional nonfinancial benefits such as soil enhancement from the increased supply of compost, as well as the municipal savings from deterring additional landfill development, will have important secondary financial impacts on the economy.
Matching Financing And Tools To Unlock Solutions
United Nations leaders set a specific target in September 2015 to “halve per capita global food waste at the retail and consumer level, and reduce food losses along production and supply chains by 2030” as part of 17 new comprehensive Sustainable Development Goals (UNDP, 2015). A week prior, the Obama administration set a national reduction food waste goal of 50 percent by 2030 (USDA, 2015).
The Roadmap clearly identifies four essential and transformative tools needed to quickly cut 20 percent of food waste and put the U.S. on track to achieve a broader 50 percent food waste reduction goal by 2030. Innovation is needed in areas of transportation and logistics, packaging and labeling, compost applications and developing small-scale distributed recycling solutions. Pervasive Education will be required to transform employee and consumer behavior. Finally, Policy is needed at the federal level to unify safe handling and donation regulations and incentives, with state/local incentives needed to spur composting and AD projects.
And every solution on the cost curve requires Financing. Those with highest returns, both financially and in terms of impact, should be prioritized.
An investment of $18 billion over the coming decade is projected to unlock $100 billion in net Economic Value, but mobilizing and deploying the variety of capital needed and ensuring it is channeled to prioritized investments will require a multistakeholder focus. The estimated $18 billion will come from private, government and philanthropic sources (Figure 4).
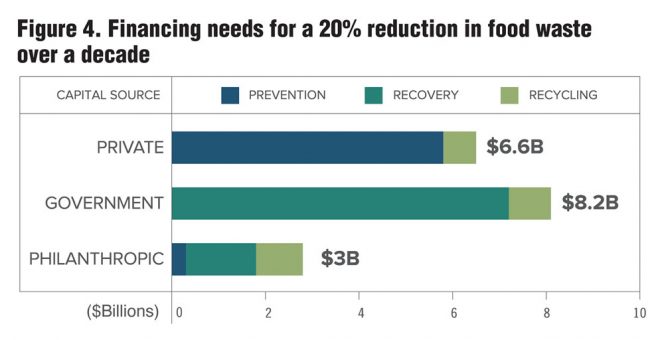
Figure 4. Financing needs for a 20% reduction in food waste over a decade
Private investment required is estimated at $6.6 billion, mainly from corporate investment driven by profit motive. Priorities for corporate investment in capital projects include Produce Specifications, Cold Chain Management, Inventory Management, Manufacturing Line Optimization, Smaller Plates, Secondary Resellers, Trayless Dining, and Waste Tracking & Analytics, potentially with support from private equity and project finance providers.
The $8.2 billion in government funding will mainly come in the form of tax incentives for food recovery building upon existing legislation. The case for marshaling government support must also be strengthened through demonstration of how these funds will directly support the public good. To this end, next steps must involve clearer quantification of the many nonfinancial benefits in the ways they align with the goals of existing food assistance programs, the dramatic resource savings including water and GHGs, and the many benefits to local communities through job creation, local energy production, soil fertility and reduced reliance on landfill disposal and transportation.
Finally, an estimated $3.0 billion is needed in philanthropic funding including grants from foundations as well as impact investments from a variety of sources. Although a majority of the financing required will flow naturally from existing government regulation and basic market forces, ReFED estimates that $100 million to $200 million/year of “catalytic capital” will enable innovative, high risk solutions to scale and overcome key project bottlenecks. To accomplish this, ReFED calls for the formation of purpose-built impact investment funds to aggregate funding sources, derisk new innovations and alleviate barriers standing in the way of projects that have yet to attract capital.
Important To All
Food waste prevention, recovery and recycling are commanding a great deal of attention in 2016. The systems for accomplishing the diversion goal of 20 percent in the near term and 50 percent in the next 15 years require further investment — of time, brainpower and dollars. Two things stand out if this undertaking is to be successful. First, a general awareness of the benefits and costs should clarify the value of action by society. Second, whether preventing waste in the first place, feeding more people through enhanced donations or creating new soil amendments — the end result is the same: We improve the ability of our food systems to feed the world.
Hunt Briggs and JD Lindeberg are with Resource Recycling Systems (RRS), and along with Deloitte Consulting LLP, led the economic analysis and core technical drafting of the Roadmap. Adam Rein is with MissionPoint Partners, an impact investing firm specializing in environmental sustainability. Mission Point served as the project lead, coordinating the resources needed to develop the Roadmap. Blythe Chorn and Kyle Tanger are with Deloitte Consulting LLP, a management consulting firm that brings expertise in energy, waste and materials to both operations and supply chains. The Roadmap can be downloaded at www.refed.org.